


New Resource – CQ Grazing Production Planner
Posted on July 11th, 2022
FBA is proud to launch the CQ Production Planner. FBA has developed the planner to help land managers in central Queensland make more informed business decisions based on climate forecasts and outlooks. To put it simply, the tool outlines what’s important and when to increase productivity and sustainability.
Graziers in central Queensland have access to a lot of valuable information, but it can be difficult to determine what’s seasonally relevant and where to find it. The CQ Grazing Production Planner is a hands-on straightforward tool that enables graziers to focus on seasonally relevant climate driver info.
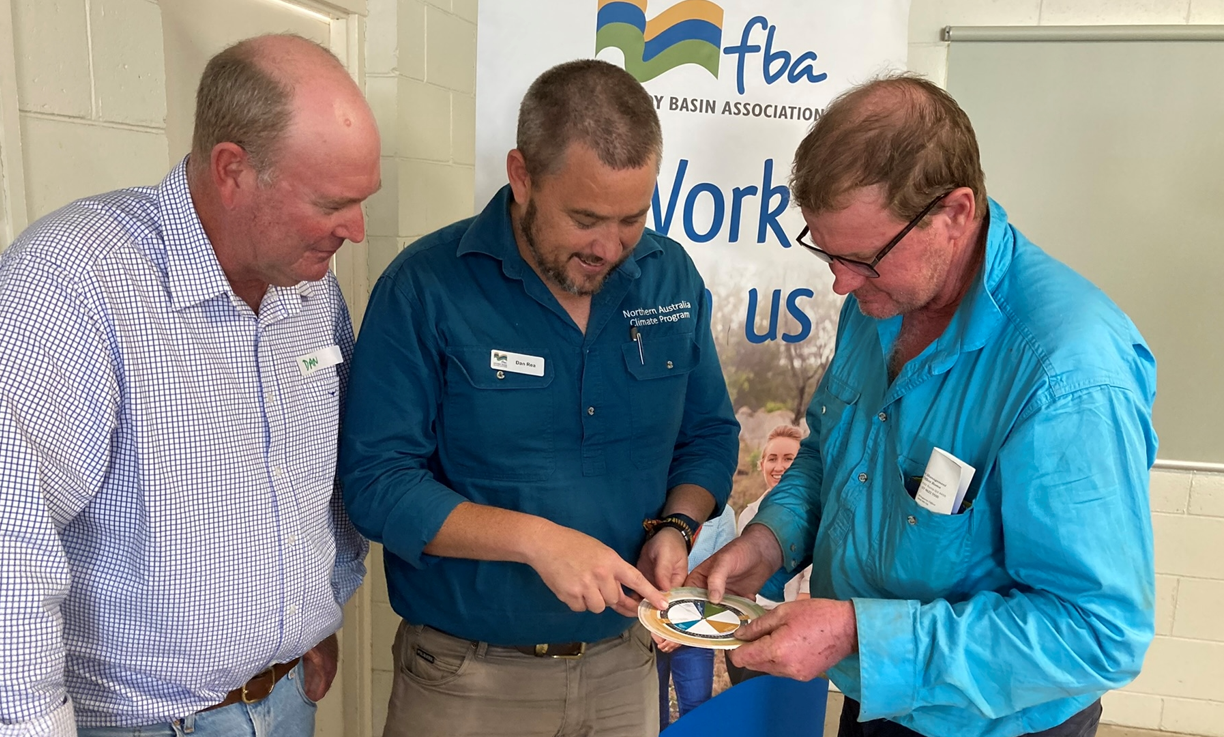
FBA’s Partnership Coordinator Dan Rea through his role as the Northern Australia Climate Program’s (NACP) Climate Mate (Fitzroy), and FBA’s Land Management Coordinator, Reece Brooks, have worked together (and with regional land managers) to create the planner. Dan brought an understanding of seasonally relevant forecast gained from his work with NACP, while Reece provided valuable best practice grazing insights.
“We have noticed an increase in local graziers’ awareness of climate variability. Their current decision-making information (based on historical rainfall data) is no longer reliable and as a result impacts their business. We are getting more and more requests from graziers to help with drought preparedness and that all starts with the information included in the CQ Grazing Production Planner,” said Reece.
“The CQ Grazing Production Planner is a useful tool for those just starting their climate forecasting and outlook journey to those who are more advanced. Whether graziers are using the planner to set key decision-making dates or to do a deep dive into regional climate information, they will see benefits. It’s not a silver bullet but it’s a great tool that will help graziers make smarter decisions for their business.”
How to use the CQ Grazing Production Planner
The first step is to determine your green date.
How to calculate your green date
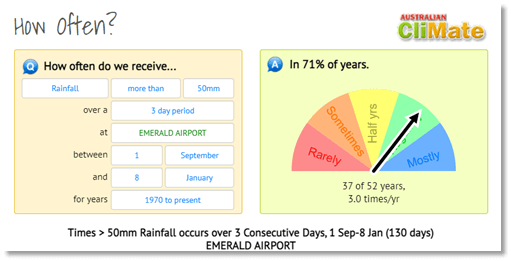
- Using the CliMate app or website click “start” and then “how often”
- Search your location to find the nearest weather station
- Set the boxes to read “rainfall” “more than” “50mm” over a “3-day period”
- The start date is always 1 September
- Adjust the end date until the “answer” is 70%.
This date = your green date
Once the green date is known, the CQ Grazing Production planner can be set (by moving the inner circle), thereby establishing all key activity periods and decision-making dates.
The below table provides links to all seasonal drivers, forecasts and outlooks listed on the CQ Grazing Production Planner with a short description of what they are.
A modelled indication of likely pasture growth for the next 3 months. The indication is in terciles (thirds) of top, middle or bottom levels of growth compared to historical records.
The Madden–Julian Oscillation (MJO) is the major fluctuation in tropical weather and can be characterised as an eastward moving ‘pulse’ of cloud and rainfall near the equator that typically recurs every 30 to 60 days. Most active in summer and into autumn.
This gives an indication of modelled pasture growth for the previous 1, 3, 6 and 12 months relative to historical records. It can be used to assess how good/poor the season has been compared to records.
This is a 1 month (April) outlook on likely rainfall compared to historical medians. It gives a good general indication if wet, dry or near-normal conditions are expected for the end of the growing season.
These two forecasts provide a month and a season (3 months) outlook on likely rainfall compared to historical medians. It gives a good general indication if wet, dry or near-normal conditions are expected.
This tracks actual rainfall for a selected period and compares it to historical records – a good indicator of how your season has been.
ENSO is the oscillation between El Niño and La Niña states in the Pacific region. El Niños typically produce drier seasons, and La Niñas drive wetter years, but the influence of each event varies.
The Indian Ocean Dipole (IOD) is defined by the difference in sea surface temperatures between the eastern and western tropical Indian Ocean. A negative phase typically sees above-average winter-spring rainfall in Australia, while a positive phase brings drier than average seasons.
The European forecast model gives an indication of seasonal (3 month) rainfall compared to historical medians looking out to 4 months in advance.
The northern rainfall onset date occurs when the total rainfall since September 1 reaches 50 mm. This forecast indicates if it will occur earlier or later than historical records.
Want to learn more?
FBA’s Land Management team are always keen to help local graziers adopt new sustainable management practices. Events are held regularly across the Fitzroy region. Check out FBA’s website calendar to see what’s coming up. Alternatively, give us a call or schedule a property visit with one of our technical advisors.
FBA wishes to give a special thanks to the landholders who volunteered their time to peer review this product.
The water quality and soil improvements in grazing and cropping enterprises in the Fitzroy project is funded by the Australian Government’s Reef Trust with support from Fitzroy Basin Association.
The NACP is funded by MLA, Queensland Government’s Drought and Climate Adaptation Program, and the University of Southern Queensland.